
The main reason for gathering statistical information is to produce reports. Reports may be tables of data, or more graphical representations such as charts may be used. The Statistics module provides one report only, the Excel based Statistics Pivot Table report. Before we can produce a report, it is necessary to retrieve the data on which to report. The steps below outline the process required to produce a statistical report:
- Open the Statistics module by clicking
 in the Command Cent
 - Click the Lookup List
 button for Key 1. A list of all the statistical data maintained by the system is displayed:
- Select the entry for the report type to be produced, e.g. Logins by User (monthly).
- If reporting on a single user or list of users as opposed to all users, the Key 2 Lookup List could be used to select the required usernames. In general, if a specific value or list of values is required for any given Key, the associated Lookup List can be used to select the values. If all values are to be reported, the Key should be left empty. In this example we want to report on the number of logins on a user basis for all users, so we leave Key 2 empty.
- Specify the date range for on which to report. In general this requires specifying a From date and a To date. In this example we want all records for January and February 2009:
- Perform the search to retrieve the required statistical records.
- Select Tools>Reports from the Menu bar to display the Reports dialog
- Click Report All to generate the report.
An Excel report will display.
Note: The report requires macros to be enabled so that a graph of the data can be produced.
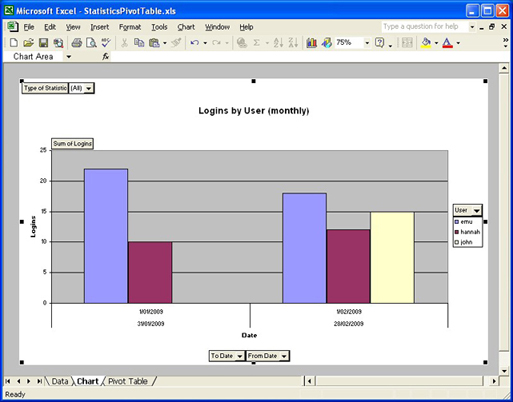
Various tables and graphs can be produced as the data is now in a pivot table, based on the different Key values supplied.
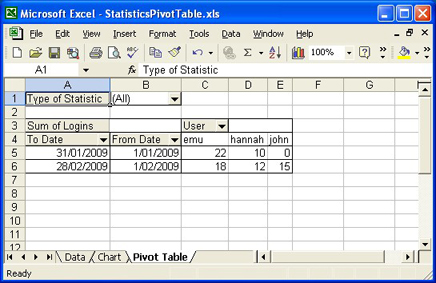
Once all the statistical information has been added to the Excel pivot table it is possible to manipulate any of the statistical variables by either restricting values or enabling all values. Pivot tables are extremely powerful and provide a very convenient mechanism for the production of reports with multiple statistical variables.
While Excel is the recommended tool for manipulating statistical data, it is possible to use any other reporting mechanism. If speciali